Practice Value

Valuations of assets should be examined from the three valuation approaches, the Market Approach, the Income Approach, and the Asset Approach. This paper will concentrate on the Market Approach, using the Direct Market Data Method.
Practice values can be tracked statistically and the statistic with the most valid correlation is the Price/Revenues (P/R) percentage. This is more reliable than Price/Net Income data because expenses can vary widely by including elective and creative expenses and are likely to be not treated universally the same. The source of the Revenue denominator varies with different appraisers, but the statistic we use is the most current year end revenues or annualizing revenues of at least six months experience since the previous period ending date. Consider the following data.
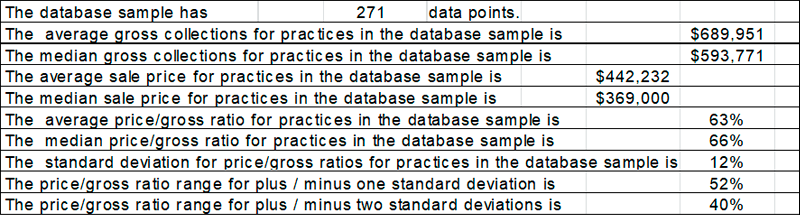
This analysis consists of 271 practice sales. In this data progression, the average P/R ratio is 63%. The median for the population is 66% which indicates that ratios in the upper half of the population have incomes that are larger in proportion to the ratios in the lower half of the population.
The other interesting finding is that the mean practice gross is $442,232 and the median practice gross is $369,000, indicating that the practice gross incomes in the upper half of the population are disproportionately higher than the practices in the lower half of the population.
We find that the mean P/R ratio is 63%, a very consistent finding over a period of time, and the standard deviation for the population is 12%. This shows how closely the data points are clustered, with one standard deviation, or 2/3 of the population, having P/R ratios in the range of 52% to 75%. Two standard deviations includes 95% of the population and practice P/R ratios range from 40% to 87%.
Here’s an interesting bell curve of distribution of P/V ratios.
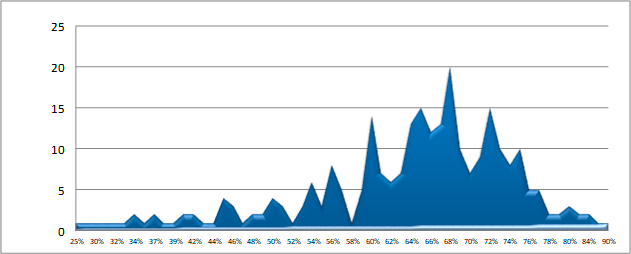
The right skewed distribution in the above graph shows how the largest percentage P/R ratios are on the right side, explaining why the median value is higher than the mean.
Now we have learned a great deal statistically from this analysis, but what does it mean to you and your practice? Here are some key points to consider.
- The average P/R ratio is 63%
- That statistic is interesting but useless information.
- Out of 271 practices, only 7 practices, or 2.5% sold at the average P/R ratio.
- If a dentist assumed his practice was worth the average P/R ratio, his chances of being wrong are 97.5%
There is a large continuum of P/R ratio values, from 22% to 90%, and many factors go into determining where any one practice is valued. We have examined the statistics and owners can see where the boundaries are, but to know exactly where in that 68% variation their own practice lies, a professional trained, experienced and educated dental practice valuation expert is required.
Professional valuations take into account the market factors that drive a P/V ratio for the subject practice and how they compare to other comparable practices that have sold and the transactional data is known. It is tempting for an owner to value their own practice, but there is an obvious lack of objectivity in this process. Owners frequently feel that their practice is extremely unique and much more valuable and desirable than all other practices, and this is a common finding. In over thirty years of valuing practices, I’ve yet to have an owner tell me that I have overvalued their practice (unlike the buyers who examine them). It is true that each individual’s practice is quite unique, just like everyone else’s.
Valuators also must consider the cash flow ability of the subject practice and the ability of the cash flow to support the market approach values derived.
While there may be some very flattering market approach results for a practice, there is the practical aspect of the finance-ability of the practice pricing. If lenders cannot prove how the purchaser is able to pay the practice overhead, pay the debt service, and pay themselves, they are not likely to provide financing for such a price, therefore making the purchase inaccessible to most all buyers. The Income Approach to value determines how much a purchaser can afford to pay and at the end of the day earn a commensurate net income for the work that they did, and there should also be a profit component in addition to this salary component. The Income Approach is the topic of another white paper though.
In summary, we can examine transactional data for dental practice sales and establish the boundaries of value. We can determine mean, median and standard deviation statistics, but these are more interesting than they are helpful. Practice valuations are best done by trained and experienced valuators who are objective in their approach, and most qualified about where any one practice value lies on the very large continuum of values and prepared to prove why.

 Add me to your address book


Testimonial from a Satistfied Dentist
"I have worked with other practice brokers before and, believe me, there is no comparison! You and your staff made what could have been a stressful and complex event a walk in the park. Your professionalism and attention to detail were not only refreshing, but were integral to the success of my recent practice purchase. I must also commend you on your network of associates who greatly simplified everything from purchasing insurance to obtaining financing. I can only say that I would heartily encourage any dentist who is considering a practice purchase to use the services you provide."
Todd Afferica, DDS
Practice Value
Valuations of assets should be examined from the three valuation approaches, the Market Approach, the Income Approach, and the Asset Approach. This paper will concentrate on the Market Approach, using the Direct Market Data Method.
Practice values can be tracked statistically and the statistic with the most valid correlation is the Price/Revenues (P/R) percentage. This is more reliable than Price/Net Income data because expenses can vary widely by including elective and creative expenses and are likely to be not treated universally the same. The source of the Revenue denominator varies with different appraisers, but the statistic we use is the most current year end revenues or annualizing revenues of at least six months experience since the previous period ending date. Consider the following data.
This analysis consists of 271 practice sales. In this data progression, the average P/R ratio is 63%. The median for the population is 66% which indicates that ratios in the upper half of the population have incomes that are larger in proportion to the ratios in the lower half of the population.
The other interesting finding is that the mean practice gross is $442,232 and the median practice gross is $369,000, indicating that the practice gross incomes in the upper half of the population are disproportionately higher than the practices in the lower half of the population.
We find that the mean P/R ratio is 63%, a very consistent finding over a period of time, and the standard deviation for the population is 12%. This shows how closely the data points are clustered, with one standard deviation, or 2/3 of the population, having P/R ratios in the range of 52% to 75%. Two standard deviations includes 95% of the population and practice P/R ratios range from 40% to 87%.
Here’s an interesting bell curve of distribution of P/V ratios.
The right skewed distribution in the above graph shows how the largest percentage P/R ratios are on the right side, explaining why the median value is higher than the mean.
Now we have learned a great deal statistically from this analysis, but what does it mean to you and your practice? Here are some key points to consider.
- The average P/R ratio is 63%
- That statistic is interesting but useless information.
- Out of 271 practices, only 7 practices, or 2.5% sold at the average P/R ratio.
- If a dentist assumed his practice was worth the average P/R ratio, his chances of being wrong are 97.5%
There is a large continuum of P/R ratio values, from 22% to 90%, and many factors go into determining where any one practice is valued. We have examined the statistics and owners can see where the boundaries are, but to know exactly where in that 68% variation their own practice lies, a professional trained, experienced and educated dental practice valuation expert is required.
Professional valuations take into account the market factors that drive a P/V ratio for the subject practice and how they compare to other comparable practices that have sold and the transactional data is known. It is tempting for an owner to value their own practice, but there is an obvious lack of objectivity in this process. Owners frequently feel that their practice is extremely unique and much more valuable and desirable than all other practices, and this is a common finding. In over thirty years of valuing practices, I’ve yet to have an owner tell me that I have overvalued their practice (unlike the buyers who examine them). It is true that each individual’s practice is quite unique, just like everyone else’s.
Valuators also must consider the cash flow ability of the subject practice and the ability of the cash flow to support the market approach values derived.
While there may be some very flattering market approach results for a practice, there is the practical aspect of the finance-ability of the practice pricing. If lenders cannot prove how the purchaser is able to pay the practice overhead, pay the debt service, and pay themselves, they are not likely to provide financing for such a price, therefore making the purchase inaccessible to most all buyers. The Income Approach to value determines how much a purchaser can afford to pay and at the end of the day earn a commensurate net income for the work that they did, and there should also be a profit component in addition to this salary component. The Income Approach is the topic of another white paper though.
In summary, we can examine transactional data for dental practice sales and establish the boundaries of value. We can determine mean, median and standard deviation statistics, but these are more interesting than they are helpful. Practice valuations are best done by trained and experienced valuators who are objective in their approach, and most qualified about where any one practice value lies on the very large continuum of values and prepared to prove why.
ADS South
Testimonial from a Satistfied Dentist
"I am Dr. Roger Bermingham, and I purchased my dental practice 28 years ago through Dr. Earl Douglas of ADS South, LLC. The experience then was so comfortable and easy that when I decided to sell my practice and retire, I could think of no one better to handle the sale than Dr. Douglas. Dr. Douglas handled the transaction from start to finish and it could not have been a more pleasant and professional experience. He identified a qualified purchaser within weeks of listing my practice and made what could have been a stressful process very easy which is a tribute to his many years of doing what he does so well. I’ll always be grateful to him for that and would recommend him to any dentist who would want to sell their practice."
Roger B. - Roswell, Georgia